Friday, December 22, 2006

Hidden Output

Tax evasion and the size of the underground economy continue to be topics of interest to many students of transition economies. These have implications for governance, fiscal capacity, and the prospects of economic growth among others. Data limitations, however, make it very difficult to explore the experience of various nations and regimes.

The BEEPS survey data prepared by the World Bank and EBRD is one potential source of data on transition economies. This business environment survey data provides information on the behavior and attributes of enterprises as well as select indicators of governance. The World Bank provides summary tabulations as well as makes the raw data available for research (see here for the BEEPS data).

Using data for 2002, the latest year where raw data is available (only tabulations of data for the 2005 survey are currently available), and discarding public enterprises, we find that Armenian firms hide 9 percent of their sales or output. This is far less than the experience of many other transition economies surveyed. Correcting for the dispersion around this mean (large standard deviations), the differences might be smaller.

Country %Mean Std. Dev.
Albania 0.25 0.23
Armenia 0.09 0.17
Azerbaijan 0.15 0.25
Belarus 0.10 0.18
Bosnia 0.34 0.34
Bulgaria 0.17 0.23
Croatia 0.13 0.18
Czech Rep 0.11 0.17
Estonia 0.08 0.13
Macedonia 0.37 0.30
Georgia 0.39 0.28
Hungary 0.12 0.20
Kazakhstan 0.17 0.26
Kyrgyzstan 0.26 0.29
Latvia 0.14 0.22
Lithuania 0.16 0.25
Moldova 0.23 0.25
Poland 0.11 0.18
Romania 0.15 0.20
Russia 0.19 0.25
Slovakia 0.14 0.19
Slovenia 0.19 0.29
Tajikistan 0.29 0.30
Turkey 0.17 0.21
Ukraine 0.16 0.27
Uzbekistan 0.10 0.21
Yugoslavia 0.26 0.30


Should we believe the BEEPS data? One way to explore the quality of the data is to examine how the size of hidden output varies by say the frequency of bribes to tax officials. Here we find that more of the sales of a firm are understated when bribes are more common. Indeed, they tend to increase with the frequency of bribes. Firms that report bribes to Never take place report 12 percent of sales to be hidden. In contrast, 31 percent of sales are reported to be hidden when bribes to tax officials Always take place.

BribeFrequency %Mean StdDev
Never 0.12 0.21
Seldom 0.21 0.25
Sometimes 0.21 0.24
Frequently 0.28 0.27
Usually 0.31 0.27
Always 0.31 0.28


The same tendencies are observed when the unreported fraction of sales are regressed on the frequency of bribes, with corrections for censoring (not every firm cheats) and sample selection (some firms refuse to participate in the survey).

BribeFrequency Coeff StdErr
Seldom 0.2174 0.0205
Sometimes 0.2282 0.0218
Frequently 0.3230 0.0254
Usually 0.3650 0.0360
Always 0.3615 0.0413


The extent of the share of sales hidden in the survey data is ascertained by the following question:

... what per cent of total annual sales would you estimate the
typical firm in your area of business reports for tax purposes?


Some may view this as a potential weakness in that we are not told of the amount under reported by the firm. Others may view this as its strength in that firms don't have to lie about their behavior. In any event, the above findings are extensively discussed in my recent paper (click here). When I limited the econometric work to Armenia instead of the cross section of transition economies, all the results fell apart. Obviously there is more to the hidden economy and its determinants than my work suggests. I would very much like to hear about the experience of others on this subject.

*****

With the holidays and other commitments, I may not be able to contribute to this blog between now and January 7. This being the season of giving, please consider sponsoring a student, a teacher, or, if it is within your means, a school in Armenia.

Happy New Year and Merry Christmas
Շնորհավոր Նոր Տարի եւ Սուրբ Ծնունդ

Wednesday, December 20, 2006

End of Year Pattern in Flights

Over the last three years, I have been watching this end-of-the-year spike in the number of flights from certain destinations. This year's numbers are at a record high. Armavia doubled its weekly flights to Moscow's Domodedovo airport in mid-November making the total weekly number of flights to Moscow 47 - the highest since June 2005. Over the past month or so, Armavia also added some new CIS destinations (Minsk, Tbilisi, Ashgabat) and doubled the number of flights to Aktau. In addition, the regular weekly flights from Sochi, Rostov, Samara, Saratov, Volgograd, St. Petersburg, Stavropol, Yekaterinburg are expected to double and even triple during the last two weeks of this year (Sochi-Yerevan 2 flights per week is to be replaced by 9 flights during the last week of December, Rostov-Yerevan 6 instead of 4 flights per week, etc.). Plus, there are some one-time flights that open up around the Christmas/New Year, like Sharm el Sheikh and Vladikavkaz.

Most likely this spike is demand-driven. I think it indicates three things: (1) where the new Armenian diaspora centers are located; (2) what the main destinations for Armenian labor migrants are; and finally (3) which business destinations actively work. We know the aggregate number of travelers at a given point in time (see here), but are there any data or statistics on the passengers for each of these three groups? Any survey results?

Tuesday, December 19, 2006

Why So Few Web Domains?

Today, there are only 6065 web domains registered in Armenia. While it is true that this number has been growing rapidly over the past few years (see here), it remains too small to be of much economic value.


Registering a domain in Armenia requires little effort (https://www.amnic.net/). The annual cost is USD 50 for foreigners, and 13200 Drams for residents (about 370 per USD). It takes a couple of days for billing and credit card payments to go through. Getting a web hosted can be more difficult from outside Armenia (annual cost about USD 100-150), particularly with the smaller ISPs who are unable to handle credit card billing. Hosting may take place on servers inside and outside Armenia (e.g. US).

For a landlocked country, whose access to the West is further restricted by the blockade by Turkey, one would have expected a greater degree of utilization of the virtual world. What explains this very low penetration, and what are its economic consequences? How much of this trend is explained by telecom problems? Or by the quality of web hosting services and service providers? Is the market too inward looking? In short, are we looking at supply or demand driven constraints? Is anyone doing research in this area?


[Added Feb 5, 2007 -- In his keynote address to the Government Leaders Forum Europe 2007, Bill Gates stated that:
... I was meeting with leaders from Armenia, and we were talking about their borders, and we were realizing that the Internet connection is the thing that allows them to reach out and really not have geographical issues or border issues be as limiting as they would have been in the past.

Saturday, December 16, 2006

Too Many Lotteries

I was flabbergasted when I read in a recent report that there are 56 lotteries and 61 casinos in tiny Armenia (see here). Many societies shun casinos and typically view lotteries as being regressive and particularly burdensome to the poor. Often lottery proceeds are used to fund education and similar public services. In other words, a "bad" is employed in the provision of a public "good."

Lotteries may be viewed as casinos on wheels where gambling opportunities are made available to virtually every household (see here). The poor generally spend disproportionately more on lotteries, and as such many view the latter as the equivalent of a regressive tax on such households. Societies tolerate the sale of lotteries because governments or nonprofits use the proceeds to subsidize many programs, education in particular. Unless I am mistaken, the 56 lotteries in Armenia are sold by the private sector and for private gain. If true, then this is no more than preying on the poor and economically most vulnerable members of the society (see here).

How are lotteries regulated in Armenia? Do we know how much in lotteries are sold annually? What are the attributes of households that purchase them (income, demographics, ...)? I checked the expenditure data in the Armenian Household Survey of 2003 (and earlier), but couldn't find any information. Is anyone doing any research on the subject?

Tuesday, December 12, 2006

Money Outflows from Armenia

Much attention is often paid to foreign investments or FDI (see here, line 22 of xls file), or to remittances by those working outside Armenia (see line 12) and gifts and transfers (see line 15). Obviously, Foreign investment is critical to Armenia's growth, and remittances and transfers from the outside are what insulate many from abject poverty.

While the above inflows are undoubtedly important, outflows are ignored for the most part. These typically take the form of compensation paid to foreigners (i.e. remittances in reverse), interest, and dividends from profits on foreign investments (FDI and portfolio) in Armenia. In the Balance of Payments Accounts these are generally reported as "Income: Debit". In 2005, such income paid to foreigners (labor and capital) stood at USD 321 million, up from only 51 million in 2000 (see line 13).


Don't know how much is paid to foreigners working in Armenia. Not sure how many work in the country or how they are compensated. But could they explain any sizable fraction of these earnings? The second potential explanation, in addition to the foreign labor, is that these may reflect interest payments on past borrowings. If so, why then the sudden jump in 2004? A third possible explanation is that profits of foreign firms may account for much of this. If so, one would have hoped that these would be reinvested in the Armenian economy and not be repatriated to the home country of the business. The sudden jump in income in 2004 may reflect the increasing profitability of investing in the Armenian economy. It may in part be explained by the appreciation of the Dram. But not sure.

It is important to identify the recipients of these earnings. The information reported on the AEA website is obtained from the IMF's International Financial Statistics which does not break down the data. Is anyone familiar with finer data?

These foreign earnings are quite large given the size of the economy. Is there any reason to be concerned?

Monday, December 11, 2006

Trade and Labor Mobility

Classical trade models suggest that trade and international labor mobility are substitutes, while other (more modern) models predict that the pressures to migrate increase with freer trade. In the recent economic research, there has been a stronger emphasis on such complementarity rather than substitutability.

I would argue that substitutability between trade and labor mobility dominates in the Armenian economy. Armenia's trade capacity is far from being fully utilized, therefore in the last decade we have observed a steady outflow of labor migrants, both high-skilled and low-skilled.

This question is partially addressed in the forthcoming World Bank publication Migration and Remittances in Eastern Europe and the former Soviet Union. However, empirical studies trying to quantify this link between labor migration and trade flows in our region are non-existent.

Sunday, December 03, 2006

VimpelCom’s Acquisition of Armentel

The recent takeover of Armentel by VimpelCom promises to open a new and exciting chapter in Armenia’s telecom prospects. VimpelCom, with its presence in Russia, Ukraine, Central Asia, and more recently in Georgia (July 2006), is perhaps better suited to serve the Armenian market than the Hellenic Telecom OTE, the current owner, with operations throughout the Balkans.

VimpelCom is a publicly traded company (NYSE symbol VIP), with the Russian Alfa Group controlling 32 percent and the Norwegian telecom Telenor controlling 27 percent of voting stock -- Alfa Group also owns 13.2 percent of Turkcell (NSE symbol TKC) which owns 41 percent of Fintur which owns 65 percent of Azercell (see here page 115). As for OTE, which is also publicly traded (NYSE symbol OTE), the Greek government controls about 39 percent of it but is planning to sell its stake in June 2007. VIP and OTE, on a pro-forma basis, were very profitable last year and during the first nine months of this year, and both have a market capitalization of about USD 16 billion.

This transaction is bound to have implications for commerce, consumer welfare, and tax revenues among others. Unfortunately, such analysis is not reported in the press, nor undertaken by academic circles and think-tanks in Armenia. What is even more sad is that western-funded organizations and analysts have also failed to provide meaningful analyses as well (see the back-to-back articles by Emil Danielyan and Vladimir Socor writing for the Jamestown Foundation). Of course, telecom and finance related outfits around the world have provided ample coverage on the transaction, as both OTE and VimpelCom disclose much of their activities to the US Securities and Exchange Commission (see here) as well as on their websites (www.ote.gr and www.vimpelcom.com). [See here for a detailed description of Armentel’s finances in Armenia.]

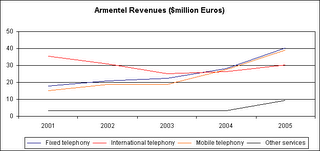
I am not an expert on IT, telecom, or the tax ramifications of this transaction. But I am hoping to jump start some discussion of its effects. For starters, fixed lines account for 34 percent of Armentel’s earnings (about 600,000 subscribers). Would VimpelCom continue to provide fixed telephony services or would it divest given its lack of experience? And if it divests, what would this mean for competition and pricing?


About 26 percent of revenue is derived from international calls. Surely VimpelCom would benefit from this stream of revenues, but one wonders how the recent acquisition of Callnet (75 percent stake) by the Russian Comstar-UTS (USD 2.6 billion market capitalization) could affect the market (see here). Callnet earned USD 4.3 in revenues in 2005, so it is very small. But given that it holds an ILD license for international calls, the prospects of real competition might be pretty good with this takeover. Also, its subsidiary Cornet is a sole provider of WiMax services in Armenia. Comstar-UTS (LSE symbol CMST), which made recent acquisitions in Ukraine, is controlled by AFK Sistema which also controls 53 percent of MTS, Russia’s largest mobile company which lost the bid for Armentel. (See here, page 14, for a list of the bidders for Armentel).

Mobile telephony accounts for a third of the revenues of Armentel, which has grown in importance over the years. The number of its subscribers in Q3’06 was 441,716, up 46 percent from the same period in 2005. The entry of VimpelCom, with its presence in neighboring Georgia, Ukraine, Russia, and Central Asia, could stiffen competition in this rapidly expanding market -- the Lebanese owned VivaCell is believed to control 60 percent of the market (this number is commonly used but strikes me as way too high -- can anyone confirm?). Also wireless internet may receive a significant boost.

OTE expects the sale of Armentel to generate a pre-tax gain of 292.9 millions euros (see here page 11, and here page 25). The amount reported for tax purposes could be different depending on the book-tax conventions employed by OTE. I know that Armentel's tax rate is only 10 percent (half the 20 percent profit tax rate -- due to tax incentives). Not sure if this tax rate or a withholding tax rate on repatriated gains would apply. Hopefully the tax authorities will not repeat past mistakes. [In 1998, OTE bought 90 percent stake in Armentel which was jointly owned by Trans-World Telecom (TWT), registered in Guernsey, and the Armenian government. In 2000, the government imposed tax and penalties of about USD 12 million on OTE for gains accrued by TWT. The treatment of OTE was inept and very unprofessional. Let’s hope this time they tax the entity that accrued the gain, i.e. OTE and not VimpelCom. On a related subject, has anyone done any research on whether it was a mistake for the Armenian government, which owned 51 percent of Armentel, to hold on to 10 percent of the shares and dilute its majority interest at the time of its sale in 1998?]

I know I have way too many questions. But it will be good to hear any opinions out there.