Friday, December 22, 2006

Hidden Output

Tax evasion and the size of the underground economy continue to be topics of interest to many students of transition economies. These have implications for governance, fiscal capacity, and the prospects of economic growth among others. Data limitations, however, make it very difficult to explore the experience of various nations and regimes.

The BEEPS survey data prepared by the World Bank and EBRD is one potential source of data on transition economies. This business environment survey data provides information on the behavior and attributes of enterprises as well as select indicators of governance. The World Bank provides summary tabulations as well as makes the raw data available for research (see here for the BEEPS data).

Using data for 2002, the latest year where raw data is available (only tabulations of data for the 2005 survey are currently available), and discarding public enterprises, we find that Armenian firms hide 9 percent of their sales or output. This is far less than the experience of many other transition economies surveyed. Correcting for the dispersion around this mean (large standard deviations), the differences might be smaller.

Country %Mean Std. Dev.
Albania 0.25 0.23
Armenia 0.09 0.17
Azerbaijan 0.15 0.25
Belarus 0.10 0.18
Bosnia 0.34 0.34
Bulgaria 0.17 0.23
Croatia 0.13 0.18
Czech Rep 0.11 0.17
Estonia 0.08 0.13
Macedonia 0.37 0.30
Georgia 0.39 0.28
Hungary 0.12 0.20
Kazakhstan 0.17 0.26
Kyrgyzstan 0.26 0.29
Latvia 0.14 0.22
Lithuania 0.16 0.25
Moldova 0.23 0.25
Poland 0.11 0.18
Romania 0.15 0.20
Russia 0.19 0.25
Slovakia 0.14 0.19
Slovenia 0.19 0.29
Tajikistan 0.29 0.30
Turkey 0.17 0.21
Ukraine 0.16 0.27
Uzbekistan 0.10 0.21
Yugoslavia 0.26 0.30


Should we believe the BEEPS data? One way to explore the quality of the data is to examine how the size of hidden output varies by say the frequency of bribes to tax officials. Here we find that more of the sales of a firm are understated when bribes are more common. Indeed, they tend to increase with the frequency of bribes. Firms that report bribes to Never take place report 12 percent of sales to be hidden. In contrast, 31 percent of sales are reported to be hidden when bribes to tax officials Always take place.

BribeFrequency %Mean StdDev
Never 0.12 0.21
Seldom 0.21 0.25
Sometimes 0.21 0.24
Frequently 0.28 0.27
Usually 0.31 0.27
Always 0.31 0.28


The same tendencies are observed when the unreported fraction of sales are regressed on the frequency of bribes, with corrections for censoring (not every firm cheats) and sample selection (some firms refuse to participate in the survey).

BribeFrequency Coeff StdErr
Seldom 0.2174 0.0205
Sometimes 0.2282 0.0218
Frequently 0.3230 0.0254
Usually 0.3650 0.0360
Always 0.3615 0.0413


The extent of the share of sales hidden in the survey data is ascertained by the following question:

... what per cent of total annual sales would you estimate the
typical firm in your area of business reports for tax purposes?


Some may view this as a potential weakness in that we are not told of the amount under reported by the firm. Others may view this as its strength in that firms don't have to lie about their behavior. In any event, the above findings are extensively discussed in my recent paper (click here). When I limited the econometric work to Armenia instead of the cross section of transition economies, all the results fell apart. Obviously there is more to the hidden economy and its determinants than my work suggests. I would very much like to hear about the experience of others on this subject.

*****

With the holidays and other commitments, I may not be able to contribute to this blog between now and January 7. This being the season of giving, please consider sponsoring a student, a teacher, or, if it is within your means, a school in Armenia.

Happy New Year and Merry Christmas
Շնորհավոր Նոր Տարի եւ Սուրբ Ծնունդ

Wednesday, December 20, 2006

End of Year Pattern in Flights

Over the last three years, I have been watching this end-of-the-year spike in the number of flights from certain destinations. This year's numbers are at a record high. Armavia doubled its weekly flights to Moscow's Domodedovo airport in mid-November making the total weekly number of flights to Moscow 47 - the highest since June 2005. Over the past month or so, Armavia also added some new CIS destinations (Minsk, Tbilisi, Ashgabat) and doubled the number of flights to Aktau. In addition, the regular weekly flights from Sochi, Rostov, Samara, Saratov, Volgograd, St. Petersburg, Stavropol, Yekaterinburg are expected to double and even triple during the last two weeks of this year (Sochi-Yerevan 2 flights per week is to be replaced by 9 flights during the last week of December, Rostov-Yerevan 6 instead of 4 flights per week, etc.). Plus, there are some one-time flights that open up around the Christmas/New Year, like Sharm el Sheikh and Vladikavkaz.

Most likely this spike is demand-driven. I think it indicates three things: (1) where the new Armenian diaspora centers are located; (2) what the main destinations for Armenian labor migrants are; and finally (3) which business destinations actively work. We know the aggregate number of travelers at a given point in time (see here), but are there any data or statistics on the passengers for each of these three groups? Any survey results?

Tuesday, December 19, 2006

Why So Few Web Domains?

Today, there are only 6065 web domains registered in Armenia. While it is true that this number has been growing rapidly over the past few years (see here), it remains too small to be of much economic value.


Registering a domain in Armenia requires little effort (https://www.amnic.net/). The annual cost is USD 50 for foreigners, and 13200 Drams for residents (about 370 per USD). It takes a couple of days for billing and credit card payments to go through. Getting a web hosted can be more difficult from outside Armenia (annual cost about USD 100-150), particularly with the smaller ISPs who are unable to handle credit card billing. Hosting may take place on servers inside and outside Armenia (e.g. US).

For a landlocked country, whose access to the West is further restricted by the blockade by Turkey, one would have expected a greater degree of utilization of the virtual world. What explains this very low penetration, and what are its economic consequences? How much of this trend is explained by telecom problems? Or by the quality of web hosting services and service providers? Is the market too inward looking? In short, are we looking at supply or demand driven constraints? Is anyone doing research in this area?


[Added Feb 5, 2007 -- In his keynote address to the Government Leaders Forum Europe 2007, Bill Gates stated that:
... I was meeting with leaders from Armenia, and we were talking about their borders, and we were realizing that the Internet connection is the thing that allows them to reach out and really not have geographical issues or border issues be as limiting as they would have been in the past.

Saturday, December 16, 2006

Too Many Lotteries

I was flabbergasted when I read in a recent report that there are 56 lotteries and 61 casinos in tiny Armenia (see here). Many societies shun casinos and typically view lotteries as being regressive and particularly burdensome to the poor. Often lottery proceeds are used to fund education and similar public services. In other words, a "bad" is employed in the provision of a public "good."

Lotteries may be viewed as casinos on wheels where gambling opportunities are made available to virtually every household (see here). The poor generally spend disproportionately more on lotteries, and as such many view the latter as the equivalent of a regressive tax on such households. Societies tolerate the sale of lotteries because governments or nonprofits use the proceeds to subsidize many programs, education in particular. Unless I am mistaken, the 56 lotteries in Armenia are sold by the private sector and for private gain. If true, then this is no more than preying on the poor and economically most vulnerable members of the society (see here).

How are lotteries regulated in Armenia? Do we know how much in lotteries are sold annually? What are the attributes of households that purchase them (income, demographics, ...)? I checked the expenditure data in the Armenian Household Survey of 2003 (and earlier), but couldn't find any information. Is anyone doing any research on the subject?

Tuesday, December 12, 2006

Money Outflows from Armenia

Much attention is often paid to foreign investments or FDI (see here, line 22 of xls file), or to remittances by those working outside Armenia (see line 12) and gifts and transfers (see line 15). Obviously, Foreign investment is critical to Armenia's growth, and remittances and transfers from the outside are what insulate many from abject poverty.

While the above inflows are undoubtedly important, outflows are ignored for the most part. These typically take the form of compensation paid to foreigners (i.e. remittances in reverse), interest, and dividends from profits on foreign investments (FDI and portfolio) in Armenia. In the Balance of Payments Accounts these are generally reported as "Income: Debit". In 2005, such income paid to foreigners (labor and capital) stood at USD 321 million, up from only 51 million in 2000 (see line 13).


Don't know how much is paid to foreigners working in Armenia. Not sure how many work in the country or how they are compensated. But could they explain any sizable fraction of these earnings? The second potential explanation, in addition to the foreign labor, is that these may reflect interest payments on past borrowings. If so, why then the sudden jump in 2004? A third possible explanation is that profits of foreign firms may account for much of this. If so, one would have hoped that these would be reinvested in the Armenian economy and not be repatriated to the home country of the business. The sudden jump in income in 2004 may reflect the increasing profitability of investing in the Armenian economy. It may in part be explained by the appreciation of the Dram. But not sure.

It is important to identify the recipients of these earnings. The information reported on the AEA website is obtained from the IMF's International Financial Statistics which does not break down the data. Is anyone familiar with finer data?

These foreign earnings are quite large given the size of the economy. Is there any reason to be concerned?

Monday, December 11, 2006

Trade and Labor Mobility

Classical trade models suggest that trade and international labor mobility are substitutes, while other (more modern) models predict that the pressures to migrate increase with freer trade. In the recent economic research, there has been a stronger emphasis on such complementarity rather than substitutability.

I would argue that substitutability between trade and labor mobility dominates in the Armenian economy. Armenia's trade capacity is far from being fully utilized, therefore in the last decade we have observed a steady outflow of labor migrants, both high-skilled and low-skilled.

This question is partially addressed in the forthcoming World Bank publication Migration and Remittances in Eastern Europe and the former Soviet Union. However, empirical studies trying to quantify this link between labor migration and trade flows in our region are non-existent.

Sunday, December 03, 2006

VimpelCom’s Acquisition of Armentel

The recent takeover of Armentel by VimpelCom promises to open a new and exciting chapter in Armenia’s telecom prospects. VimpelCom, with its presence in Russia, Ukraine, Central Asia, and more recently in Georgia (July 2006), is perhaps better suited to serve the Armenian market than the Hellenic Telecom OTE, the current owner, with operations throughout the Balkans.

VimpelCom is a publicly traded company (NYSE symbol VIP), with the Russian Alfa Group controlling 32 percent and the Norwegian telecom Telenor controlling 27 percent of voting stock -- Alfa Group also owns 13.2 percent of Turkcell (NSE symbol TKC) which owns 41 percent of Fintur which owns 65 percent of Azercell (see here page 115). As for OTE, which is also publicly traded (NYSE symbol OTE), the Greek government controls about 39 percent of it but is planning to sell its stake in June 2007. VIP and OTE, on a pro-forma basis, were very profitable last year and during the first nine months of this year, and both have a market capitalization of about USD 16 billion.

This transaction is bound to have implications for commerce, consumer welfare, and tax revenues among others. Unfortunately, such analysis is not reported in the press, nor undertaken by academic circles and think-tanks in Armenia. What is even more sad is that western-funded organizations and analysts have also failed to provide meaningful analyses as well (see the back-to-back articles by Emil Danielyan and Vladimir Socor writing for the Jamestown Foundation). Of course, telecom and finance related outfits around the world have provided ample coverage on the transaction, as both OTE and VimpelCom disclose much of their activities to the US Securities and Exchange Commission (see here) as well as on their websites (www.ote.gr and www.vimpelcom.com). [See here for a detailed description of Armentel’s finances in Armenia.]

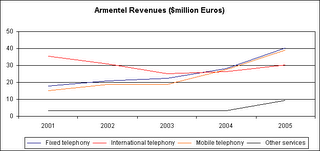
I am not an expert on IT, telecom, or the tax ramifications of this transaction. But I am hoping to jump start some discussion of its effects. For starters, fixed lines account for 34 percent of Armentel’s earnings (about 600,000 subscribers). Would VimpelCom continue to provide fixed telephony services or would it divest given its lack of experience? And if it divests, what would this mean for competition and pricing?


About 26 percent of revenue is derived from international calls. Surely VimpelCom would benefit from this stream of revenues, but one wonders how the recent acquisition of Callnet (75 percent stake) by the Russian Comstar-UTS (USD 2.6 billion market capitalization) could affect the market (see here). Callnet earned USD 4.3 in revenues in 2005, so it is very small. But given that it holds an ILD license for international calls, the prospects of real competition might be pretty good with this takeover. Also, its subsidiary Cornet is a sole provider of WiMax services in Armenia. Comstar-UTS (LSE symbol CMST), which made recent acquisitions in Ukraine, is controlled by AFK Sistema which also controls 53 percent of MTS, Russia’s largest mobile company which lost the bid for Armentel. (See here, page 14, for a list of the bidders for Armentel).

Mobile telephony accounts for a third of the revenues of Armentel, which has grown in importance over the years. The number of its subscribers in Q3’06 was 441,716, up 46 percent from the same period in 2005. The entry of VimpelCom, with its presence in neighboring Georgia, Ukraine, Russia, and Central Asia, could stiffen competition in this rapidly expanding market -- the Lebanese owned VivaCell is believed to control 60 percent of the market (this number is commonly used but strikes me as way too high -- can anyone confirm?). Also wireless internet may receive a significant boost.

OTE expects the sale of Armentel to generate a pre-tax gain of 292.9 millions euros (see here page 11, and here page 25). The amount reported for tax purposes could be different depending on the book-tax conventions employed by OTE. I know that Armentel's tax rate is only 10 percent (half the 20 percent profit tax rate -- due to tax incentives). Not sure if this tax rate or a withholding tax rate on repatriated gains would apply. Hopefully the tax authorities will not repeat past mistakes. [In 1998, OTE bought 90 percent stake in Armentel which was jointly owned by Trans-World Telecom (TWT), registered in Guernsey, and the Armenian government. In 2000, the government imposed tax and penalties of about USD 12 million on OTE for gains accrued by TWT. The treatment of OTE was inept and very unprofessional. Let’s hope this time they tax the entity that accrued the gain, i.e. OTE and not VimpelCom. On a related subject, has anyone done any research on whether it was a mistake for the Armenian government, which owned 51 percent of Armentel, to hold on to 10 percent of the shares and dilute its majority interest at the time of its sale in 1998?]

I know I have way too many questions. But it will be good to hear any opinions out there.

Sunday, November 12, 2006

Istanbul, November 12, 1942

While much of the recent news in the media have addressed current events or events that took place during a period leading to the First World War, we should not forget that today is the 64th anniversary of a horrible event that struck Armenians, entrepreneurs in particular, in Istanbul. Indeed, I would be remiss if I did not say a word or two on the treatment of Armenian and other minority (jewish, greek, and assyrian) businessmen in Turkey during the Second World War.

On the morning of November 12, 1942, the citizens of Turkey woke up to the most draconian wealth tax ever envisaged. While the tax in theory applied to the entire predominantly Muslim nation, in practice much of its burden rested with the minority Christian and Jewish communities who primarily resided in Istanbul, formerly known as Constantinople. Neither the rate of taxation nor the taxable base and its derivation were made public. Tax assessments were arrived at in secret, and individuals were directed to settle their government assessed liabilities within two weeks, without any appeal provisions in place. The penalty for Christians and Jews who failed to do so within a month was deportation to forced labor camps in eastern Turkey in addition to having their property confiscated.

Faik Okte, the administrator of this tax at the Turkish Ministry of Finance wrote a book on the subject documenting all of its features and naming its victims. The book has been translated from the Turkish "Varlik Vergisi Faciasi" into English and is entitled "The Tragedy of the Turkish Capital Tax," by Geoffrey Cox, Croom Helm, 1987.

Because the tax was at best arbitrary, the effective tax rates that businesses had to pay fluctuated widely. The assessed tax often exceeded the entire wealth of business owners which inevitably led to their deportation to labor camps in addition to the confiscation of their properties. C.L. Sulzberger, writing for the New York Times, documented how burdensome this tax was, and in particular the pain it inflicted on the Armenians. See below:

Effective Tax Rates by Religious and Ethnic Affiliation
Merchants by Affiliation ...... Tax Rates (%)
Muslim Merchants ..................... 4.94
Greek Orthodox Merchants...... 156.00
Jewish Merchants.................... 179.00
Christian Armenian Merchants 232.00

Source: C.L. Sulzberger, “Turkish Tax Kills Foreign Business,” New York Times, September 11, 1943.

Thursday, November 09, 2006

Economic Development in Artsakh

The President of NKR, Arkady Ghoukasian, is on his way to the US to participate in the upcoming Armenia Fund 9th annual telethon in Los Angeles scheduled for November 23rd. Proceeds from this Telethon are to benefit the region of Hadrut in Artsakh. Projects include the construction of a hospital, schools, water pipelines, as well as drawing a regional development plan. The plan is similar to that of the Martakert Regional Development plan currently underway. Examples of the latter include the reconstruction in Shushi (see here) or Martakert Hospital (see here).

Last year’s Telethon raised USD 7.7 million in funds. These funds go a long way in helping the local economy and its infrastructure. The country also benefits from a number of foreign investments in its economy and growing tourism. GDP grew by 15 percent in 2005, but off a very small base. Indeed, GDP more than doubled between 2001 and 2005, from USD 53 million to 114 million. Construction grew by some 38 percent in 2005 (see here).

Obviously it goes without saying that Karabakh, with a per capita GDP of under USD 1,000, needs to grow faster and undoubtedly can use more assistance. My major interest rests with what is happening on the education front, higher education in particular. For Artsakh, as in the case of Armenia or any other country, aid is not a sure way to prosperity. Aid goes a long way, but it is the stock of human capital that is key to growth and expanding economic development and opportunities – making the desert bloom so to speak. But this takes more than just funding. Do we know much about Artsakh State University in Stepanakert? What fields do they teach? Where do their graduates go?

Saturday, November 04, 2006

Privatizing the New Gas Pipeline

Recent news have nearly confirmed that a firm in Armenia, partly owned by Russians, is about to acquire the Armenia-Iran gas pipeline under construction (see here). I know that a lot of people have complained that another vital industry is being taken over by the Russians. But this outcome is in many ways inevitable in the marketplace for energy related resources in that region, particularly as the acquiring firm is also the owner of the gas distribution network and a number of thermal power stations.

The government is ill suited to manage the energy resources of the country, both in generation and distribution. So privatization is the only way to go. However, is all this secrecy and behind the door negotiations leading to the transfer of these assets necessary? Why not simply have an open bidding process. Granted that the very same firm will most likely win the bid, and take over these assets, but at least the process will be transparent. This will likely help facilitate similar future transactions (reputation effect), as well as potentially yield a higher price for tendering these assets as more firms bid for them.

Many were critical of a similar process by which the electricity distribution network was privatized only a few years ago. A major critic of the transaction at the time was the World Bank. Yet in recent analysis, the Bank has reported to be very pleased with the outcome if not the process of the privatization (see here).

Again, I think the focus should be on the process and not the acquirers of the privatized assets. However, equally if not more important is the effect of this and similar transactions on market concentration and the creation of a vertically integrated monopoly in Armenia.

Wednesday, October 25, 2006

Rapid but Unbalanced Growth

Armenia's GDP grew by 12.5 percent in the first nine months of 2006, in what promises to be the fifth year of the country's stunning annual double digit growth rate. The largest growth was experienced in construction which grew by 40 percent over the same period in the previous year. This sector accounted for one fifth of the GDP in 2005, and seems to be the only sector that experienced any significant growth.

The pattern of economic activity is a bit odd in that the country is experiencing a tremendous growth in construction yet very little of that has translated into robust growth in other sectors of the economy. One would expect construction growth to translate into greater demand for manufactured goods such as metal works and wiring, furniture, draperies, and carpets, faucets and plumbing supplies, appliances and so forth. I suspect that much of this demand is met by imports rather than domestic production. Indeed, imports grew by 19.4 percent in the first nine months through September, to USD 1,508 billion, while exports were USD 700 million, or about one percent down. One is tempted to blame this on the appreciating Dram. But perhaps there is something more structural at play. Looking at exports and imports in 2005 (see below and here and here) one cannot help but notice the lack of diversity in Armenia’s exports in contrast to that of its imports.

2005 Export (USD millions)
Foodstuffs 97
Ores and minerals 79
Textiles 37
Precious and semiprecious stones, metals 336
Non-precious metals 315
Other 86
Total 950

2005 Imports (USD millions)
Live animals and animal produce 43
Vegetable produce 97
Foodstuffs 144
Ores and minerals 295
Chemical products 115
Plastic and plastic products 47
Textiles 45
Precious and semiprecious stones, metals 348
Non-precious metals 92
Machinery and equipment 227
Transportation 146
Other 170
Total 1768

In addition, there is also the nagging question of the ability of Armenian businesses to compete and market their products globally. A 2004 study commissioned by USAID provides good examples of this (see here).

Obviously the rising value of the Dram is not helpful, but more needs to be done to explore the underlying causes of the developing structure of Armenia’s economy.

Thursday, October 12, 2006

Soaring Real Estate Prices

Real estate values keep up their upward march. Prices have more than doubled, tripled in some cases, over the past three or four years (see here excel file, also see cadastre.am in Armenian). In central Yerevan, the price per square meter was US 631 in 2005 compared to 328 in 2002. However, the price in the Nubarashen district of Yerevan was only USD 152 in 2005, but also grew rapidly up from 50 in 2002. [A square meter is 10.76 square feet]

In contrast to the capital, prices in the regions or marzes remain low but otherwise exhibit similar growth. In Dilijan, for instance, the price increased from USD 26 per square meter in 2002 to 64 in 2005. Similarly, the price in Sevan increased from USD 24 to 54 over the period 2002 and 2005.

The overall number of transactions nearly tripled from 44792 in 2001 to 122545 in 2005.

It should not be surprising that prices are much higher in Yerevan, particularly given the pace of construction with much of it taking place in the capital (see here, also see armstat.am for more recent and location specific activity). But how long will this price appreciation continue, and what is driving it? Is there any evidence of local speculators? Who is building (and profiting from) the new construction? Are there any distributional issues we should worry about as the poor are frozen out of the market (as in the example in here)? Are we approaching a bubble of sorts, and are mortgages outstanding large enough to be an issue?

How much of what we see is driven by Diaspora purchases of apartments in Yerevan, and how would prices in the capital and more importantly the regions change once the Diaspora is allowed to buy land? How much the prohibition on Diaspora land purchases distorts real estate activity (and prices)?

[Please email me if interested in contributing]

Friday, October 06, 2006

Georgia, Russia, and Armenia’s Economy

The rising tensions between Georgia and Russia, and the severing of land and air links between the two neighboring countries, may have serious implications for the economy of landlocked Armenia.

Russia is the leading source of imports by Armenia (see AEA – excel file). It imported USD 260 million from Russia, or some 15 percent of its total imports of USD 1768 million in 2005. Much of this is in the form of critical energy, raw materials, and other intermediate goods. Imports of uncut diamonds, given their weight and volume, may not be impacted by the trade “embargoes,” and the pipeline shipments of natural gas are not yet slated to be cut. But the imports of many other products will be severely impacted. As an example, in 2005, Russia accounted for 84 percent of Armenia’s imports of cereals valued at USD 45.1 million and weighing 301,942 tons (see here – in Armenian and can be very slow). It also accounted for over one third of Armenia’s imports of vehicles and heavy machinery (USD 50 million), and about 10 percent of many other products.

The following is a breakdown of imports by country (diamonds feature prominently in the trade with Belgium and Israel):

Total imports 1767.9 USD millions
Russia 259.5
Belgium 162.4
USA 116.0
Germany 114.0
Israel 102.5
Iran 102.0
Other 911.5

Exports are much smaller but relatively no less important, given the country’s GDP of less than USD 5 billion. Armenia exported USD 119 million to Russia in 2005, or some 20 percent of the total exports of 950 million, making the latter the fourth largest importer of Armenian goods, after Germany, The Netherlands, and Belgium (see AEA). Beverages and spirits represent much of what Armenia exports to Russia, valued at USD 71.3 million and weighing 23,258 tons (see here – in Armenian and can be very slow). Indeed, this represents about 85 percent of all Armenian beverage exports in 2005.

The following is a breakdown of exports by country (diamonds feature prominently in the trade with Belgium and Israel):

Total exports (USD millions) 950.4
Germany 147.2
Netherlands 130.1
Belgium 124.6
Russia 119.1
Israel 112.2
USA 62.1
Other 255.0

Regardless of the trading partners, much of Armenia’s imports and exports pass through Georgia and its ports on the black sea. As such, the stability and prosperity of Georgia are critical as well.

Airline traffic will also be affected. There are about 80 weekly flights from Yerevan to destinations all over Russia (see AEA, the overall number may vary with season). Half of these are served by Russian airlines which will not fly over Georgia. The necessary detours will most likely add to the duration of the flights and to the cost of air travel.

One hopes wisdom prevails as Georgia and Russia settle their differences. In the meantime do we know of any ongoing research on shipping costs to and from Armenia on various modes of transportation? There are considerable amounts of statistics on the volume and how goods are shipped (see AEA), but little is reported on costs.

Wednesday, October 04, 2006

Trends in Dram Circulation

While reviewing the data on currency circulation recently posted on the website of the Armenian Economic Association, I was intrigued by the pattern of Drams held outside the Central Bank. The volume of Drams in circulation grew by some 47 percent in 2005, to 155 billion [see here, column N]. Of course this is not the first time that such rapid growth was experienced. The growth rate in 2002, for instance, was 38 percent. Indeed, Drams in circulation ranged from 26 billion Drams in 1995 to 155 billion in 2005.

It may be useful to explore the underlying trend of the various Dram denominations and examine where much of the growth is coming from. The 20000 note, with 40.2 billion Drams in circulation in 2005, has experienced the fastest growth since it was first issued in 1999 (see here). Similarly, the 10000 note grew rapidly since it was first issued in November of 2003, as well as the 50000 notes since it was first issued in June of 2001.

Here is the trend in circulation of the largest denominations (in billion Drams):

Denomination 2001 2002 2003 2004 2005
5000 drams 32.58 40.41 44.94 37.82 48.84
10000 drams 0.00 0.00 7.30 25.22 42.98
20000 drams 12.35 24.16 23.04 21.02 40.20
50000 drams 0.78 1.61 1.39 0.95 1.61

This trend is in many ways fascinating. But what explains it? What does it tell us about economic growth? About the shadow economy? About errors in measuring the true growth of the Armenian economy? Also, are there studies of the demand for the various denominations?

Tuesday, September 26, 2006

Air Transportation

The opening of the new arrival wing of the Zvartnots airport, designed to handle 2 million passengers annually, represents the culmination of a dazzling growth and expansion in air transportation in Armenia.

Indeed, the number of passengers arriving in Armenia nearly doubled to 575,000 in 2005 up from 293,000 in 2000 (see below and check here and here for more details).

2000 292,800
2001 375,900
2002 434,000
2003 458,500
2004 559,100
2005 574,700

Similarly, the number of foreign airlines carrying passengers to and from Yerevan has expanded dramatically as well. In 1994, an Air France weekly charter flight was the only hope for a westerner of making it to the country. Today, there are daily flights that connect passengers from four corners of the world to Armenia. Passengers have the choice of Air France, Austrian Airlines, British Airways (Med), Czech Airlines, Lufthansa, and Aeroflot, in addition to Armavia (armenian airlines), that make it possible to fly into Yerevan on any day of the week. Amsterdam, Frankfurt, London, Moscow, Munich, and Paris, among others, provide travelers to and from Armenia access to the world’s premier airlines and destinations.

The changing face of air traffic is impressive, particularly when compared to that a decade ago. The flight patterns show a marked orientation to the west. But they also reflect Armenia’s sprawling Diaspora (see here). Destinations to various cities in Russia and other parts of the former Soviet Union, as well as those to the Middle East, in many ways highlight the ties that keeps Armenians connected.

Notwithstanding the experience in passenger traffic, air cargo shipments have yet to take off. For the years 1999 through 2004, for instance, exports and imports tonnage totaled (check here): 13.5, 13.8, 11.4, 8.4, 8.7, and 9.2 only. (please help update this and other data sources). Is this a resource waiting to be tapped? Clearly, the composition of exports today makes very little demands on the airline industry (see here). But shouldn’t this composition itself evolve to reflect the availability of air transport?

Also, the seat factor is increasing but was about 68 percent in 2003 (see here). Recent figures may be higher. Nevertheless, it looks like planes are flying 30 percent empty. There are also significant flight delays – more than a third of all flights (see here).

Has anyone undertaken a study of the airline industry? This is an industry highly critical to the prosperity of the Armenian economy.

[Please write me if interested in contributing]

Sunday, September 24, 2006

Market Concentration

A recent report by RFE quotes an Armenian businessman and a member of the parliament complaining about the lack of "free enterprise and fair competition in the country." This is despite the fact that Armenia is ranked as the 27th, far ahead of many countries, by the Heritage Foundation and the Wall Street Journal index of economic freedom.

The big question is how much market concentration is there in Armenia. This is important as it reflects on the degree of competition (and monopoly power) in the economy. Do we see this in the data? Has anyone done any comprehensive study, sector by sector, on how many firms there are in each sector, and their market share? I know that some are concerned about the extent of ownership and control by certain government officials, but that is a secondary question. It is more critical to explore whether the existing market structure hinders economic growth and hurts consumers.

The clearest signal of lack of competition, albeit not always perfect, is the price wedge between similar Armenian and foreign goods and services. Armentel might be a good case in point, but at least it paid in advance for this monopoly right. Another example is the government's favoring Armenian over foreign airliners (e.g., much better hours of arrival and departure). Of course, legal monopolies and the protection of domestic industries have their costs, regardless of the motivation and transparency. But other more egregious forms of market control can be far more damaging to the economy and prosperity of the country. One example is the rumored shortage of jet fuel which has allegedly caused delays and cancellations of flights earlier in the year.

So, again, the question is whether we know of any studies on market concentration. If not, is anyone out there aware of any data sources that could be explored to undertake such study?

Tuesday, September 19, 2006

Economics and Finance Education

Reading the plan for the construction of the new Moscow School of Management with a price tag of USD 70 million in today’s Financial Times, brought to mind the dire situation Armenia finds itself in. In particular, the statement that “While Russian universities have a powerful academic reputation in the sciences, they have no history in teaching western-style management” hits home. More to the point, there is no history of teaching economics and finance in Armenia, and no one seems to be aggressively promoting academic excellence there.

Last October, when I taught economics in Yerevan, I was struck by the lack of textbooks in most if not all areas of economics, finance, business, actuarial sciences, among others. Textbooks didn’t really exist at both undergraduate and graduate levels. For the graduate level, and for those with advanced training in math and are fluent in English, students may tap into online lecture notes and textbooks available from the servers of a number of universities around the world (check
AEA). Software such as Matlab and Mathematica commonly used in the teaching of advanced economics simply do not exist. At the undergraduate level, only a couple of textbooks have been translated into Armenian. Not only students are handicapped by the lack of textbooks and training materials, but the situation is further aggravated with official faculty salaries well below USD 200 per month.

It is not that funding is lacking, but that these funds are seldom diverted to improve the educational standing of academia. Tens of $millions have been spent on tax reform and tax administration projects. Yet there is not a single public finance textbook in the country. Millions are poured into the banking/financial sector, yet finance/corporate finance textbooks don’t exist. Similarly, no textbooks are available in the actuarial sciences despite the ongoing pension reforms. For those undergraduates with the means and fluency in English, getting over the lack of textbooks may not be an insurmountable task. But what are the majority remaining students, and their faculty, supposed to do. For those graduating undergraduates interested in an MBA, the American University of Armenia is perhaps the way to go. But otherwise, there is much to be done to raise the quality of training and funding of faculty and academia in all the remaining fields (see
assessment).

Today’s students are the future leaders in commerce and finance of Armenia. One would hope that those present at the ongoing Armenia-Diaspora Conference are paying attention.

Friday, September 15, 2006

Foreign Investments in Armenia

Foreign direct investments (FDI) in Armenia has been steadily growing over the years, except for the spike in 1998 when the national telephone company (Armentel) was acquired by the Hellenic OTE firm. These tend to be relatively small, but have shown a very healthy growth pattern. In 2005, FDI stood at USD 258 million and made up about 7 percent of GDP (click here for a trend).

The Armenian statistical agency (armstat.am), in a recent release, reported FDI for the first half of the year to total USD 86.3 million, or 9.3 percent higher than that for the same period in 2005. Interestingly, more than 40 percent of the FDI took place in the telecom and air transport sectors which should go a long way in relaxing some of the constraints imposed by the land-locked geography of Armenia.

FDI by sector in 2006H1
Telecom 33.1%
Mining 14.3%
Air Transport 9.4%
Other 43.2%

The total foreign investment for the first half of the year was actually USD 178.5 million (27.9 percent growth over same period in 2005), of which 86.3 million is FDI. I guess the difference is dividend investment. But what is it invested in? How much of it is debt purchase, minority ownership in a corporation, and so on? The breakdown of this foreign investment is interesting. Lebanese investors, with about USD 50 million, lead the way. They are closely followed by Greece, and from a distance by Russia, Argentina, the US, and Germany.

Total Foreign Investment in 2006H1 (USD million)
Lebanon 49.6
Greece 37.9
Russia 19.2
Argentina 17.3
US 14.9
Germany 12.1
Other 27.5
Total 178.5
FDI 86.3

It is not clear how the recent destruction of its economy by Israel will affect future investments from Lebanon. Greece continues to play a critical role by its steady and sizeable investments in Armenia. Russia’s investments seem to be too low by any yardstick. Argentina has been on the radar screen for a number of years by its investment in the Zvartnots airport in Yerevan. US investors do not seem to have much of a presence particularly given the size of their economy. However, Germany has made its presence felt, particularly as it represented the largest export market for Armenian goods in 2005 (click
here).

Does anyone have a time series of the FDI data by source (country) and sector? It will be good if this can be posted on the
AEA website, unless available online elsewhere, so that it will be accessible to researchers. The Economy and Values Research Center in Yerevan has done some work on the role of the Diaspora. But besides that, is there any research done on their economic impact as well as the rate of return on such investments? Equally important, has any research been done, other than that by the World Bank, on impediments to such investments?

Friday, September 08, 2006

The Armenian IT Sector

The global market for western spending on IT services is about $50 billion (The Economist). It will be a major feat if Armenia were able to capture any portion of it, as many hope it will.

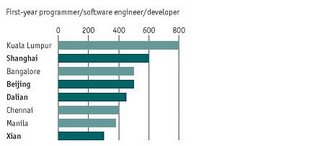
Much of the western Business Processing outsourcing is captured by India. China is far behind, but is gradually catching up. For instance, consider the city of Xian in Western China. The government, at a cost of USD 12 billion, is in the process of expanding a technology park to 90 sq km, housing 7,500 companies, supported by more than 100 universities with annual graduates of 60,000 in computer science alone (from the Economist).

Given its size and development stage, can Armenia truly compete? Could western outsourcing represent a significant source of income to Armenians? A cursory look at the prevailing monthly salaries in Asian counties (below in USD, from The Economist), with over half the world’s population, should be a clear indicator of the limited potential of outsourcing to Armenia. Indeed, the IT sector in Armenia employed only 3,000 individuals in 2003, with annual salaries of about USD 5,000 for experienced developers.


Outsourcing is unlikely to contribute in any significant way to economic growth in Armenia. In all likelihood, the IT sector will expand with domestic opportunities, and the demand for it in the telecom, travel, hospitality, and healthcare sectors, as well as the growing accounting and business services. In turn, the IT sector will enhance the productivity of the Armenian economy. Today, for instance, it takes much less time to make a hotel reservation, or clear through immigration and customs at the airport in Yerevan then it did less than a decade ago.

I am sure there is some IT component in the export of services from Armenia. Are there any statistics on their magnitude or potential volume? Is Armenia a net exporter or importer of IT intensive services? Also, do we know much about the educational system and training available in Armenia, both at the technical and managerial levels?

Thursday, August 17, 2006

Money Velocity

One would expect that the money velocity should have gone up significantly in Armenia over the last decade or so. Money velocity is basically a measure of how fast each dram in circulation turns over in the economy. When businesses and consumers are confident, they are willing to spend their money faster, which leads to an increase in velocity, and vice-versa. Introduction of ATM machines and various electronic payment systems in turn enhance the circulation of money and increases its velocity.
However, the existing data suggest that the money velocity of Dram, measured as the ratio of GDP to monetary base, has a downward trend. As the figure below suggests, there are also large seasonal fluctuations.
Are there any studies exploring the reasons for this trend?

Wednesday, August 16, 2006

Exports and Imports of Armenia

Imports into Armenia stood at USD 1768 million in 2005, which represents an increase of 31 percent over 2004. Armenia exported USD 950 million in goods in 2005, also representing an increase of 31 percent. Perhaps this rapid growth in trade is not surprising. However, the recent emergence of Germany and the Netherlands as major trading partners of Armenia was quite unexpected. These two countries are the leading export markets for Armenian goods, and account for almost 30 percents of all exports. Below are the exports to the top 10 markets over the past five years.

Exports ...... 2001 2002 2003 2004 2005
Total ........... 342 505 686 723 950
Germany.... 11 28 44 83 147
Netherlands 1 11 22 26 130
Belgium ..... 46 92 124 108 125
Russia ........ 61 65 94 78 119
Israel ......... 33 88 142 98 112
USA ........... 52 46 56 71 62
Georgia ..... 12 17 19 29 39
Switzerland 9 8 33 45 35
Italy ........... 6 12 19 28 26
Iran ............ 32 31 22 31 25

What is Armenia exporting to Germany and the Netherlands? I suspect much of this is perhaps metal products such copper and aluminum. Exports of non-precious metals, for instance, expanded from USD 138 million in 2004 to USD 315 million in 2005. Is there anyone who can shed light on this? I presume much of the exports to Belgium and Israel are polished diamonds.

Imports also kept pace with exports, but with some reshuffling of the leading trade partners. Russia is the leading exporter to Armenia, and the primary source of energy imports. Russia, Belgium, and Israel are also important sources of uncut diamonds. Not sure what Armenia imports from Germany, UK, and Switzerland. Again, it will be great if anyone out there can shed light on this. Below are the imports from the top 10 leading countries over the past five years. What is Panama doing on this list, and what does Armenia buy from it?

Imports .... 2001 2002 2003 2004 2005
Total ........... 877 987 1279 1351 1768
Russia ......... 174 193 203 180 259
Belgium ...... 42 91 129 109 162
USA ............ 84 53 111 105 116
Germany ... 34 43 44 74 114
Israel ......... 28 83 124 100 102
Iran ............ 78 63 70 76 102
UAE ........... 47 43 60 65 98
UK .............. 91 28 83 107 91
Switzerland 27 10 53 46 86
Panama ..... 19 3 38 46 71

Imports are likely to expand as Armenia’s economy expands. Growth in exports is more tricky to predict as it depends on supply factors or constraints. Indeed, other than cut diamonds and the recent surge in non-precious metals, Armenia exports very little. Is there a good explanation for this? Has anyone looked at how sensitive exports and imports are to the appreciation of the Dram? Is anyone aware of any studies or business surveys of future trends in trade?

[Please email me if you are interested in contributing.]

Thursday, August 10, 2006

The Value of the Dram

The continued appreciation of the Dram is very much in the news in Armenia. It recently hit the 400 Drams to the USD mark, continuing the appreciation began in 2004, and reversing the trend observed in the previous 10 years (see below).

1995 1996 1997 1998 1999 2000 2001 2002 2003 2004 2005
406 414 491 505 535 540 555 573 579 533 458

What are the determinants of the exchange rate ?
The value of the Dram is likely to be determined by supply and demand for the currency. On the demand side, remittances from migrant workers, and the diaspora, old and new, maybe as high one third of GDP. Some 300,000 tourists visited Armenia in 2005, up from tens of thousands only 5-6 years ago. FDI is growing and may account for at least some 5 percent of GDP. On the supply side, imports exceeded exports in 2005 by some USD 800 million, or some 18 percent of GDP. Of course there is this whole question about the growing confidence in the Armenian economy and its currency which may not be reflected in any of the underlying economic trends. Some of the media in Yerevan have been making the case for government manipulation of the currency. It is hard to envision how a country of USD 4 billion GDP can manipulate for so long the value of the US currency. Do we know anything about the state of the foreign currency reserves at the CBA? Is there any outstanding research on the subject?
Also the value of the Dram may have serious economic implications. Are there any studies on the impact of the currency on the competitiveness of the Armenian economy (imports, exports, capital account)?

Welcome

Welcome to the new Armenian Economist blog.
The mission of the new blog is to bring interested economists and professionals together to share their expertise and knowledge of developments in the Armenian economy.
No need to register. Anonymous comments are allowed. Just enter your comments, preview, and then click publish.